Creating and Analyzing Network Flow Logs in AWS
Understanding and monitoring your network traffic is crucial for security and performance optimization in the world of AWS cloud administration. You may record and examine network activity inside your Virtual Private Cloud (VPC) environment using Network Flow Logs, a powerful tool provided by Amazon Web Services (AWS).
In this article, we will walk through the creation and analysis of network traffic logs at the VPC, subnet, and network interface levels.
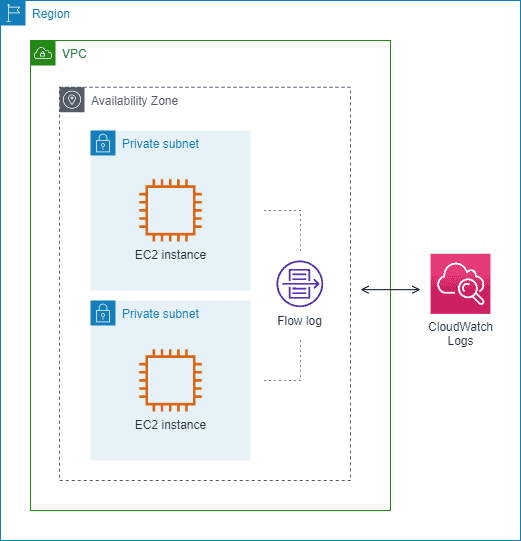
Creating VPC Flow Logs and Analyzing with CloudWatch
Step 1. Creating VPC Flow Logs
VPC flow logs provide an overview of all traffic entering and leaving the entire VPC, giving you insights into the overall network behavior.
Log in to your AWS Management Console.
Go to the VPC Dashboard.
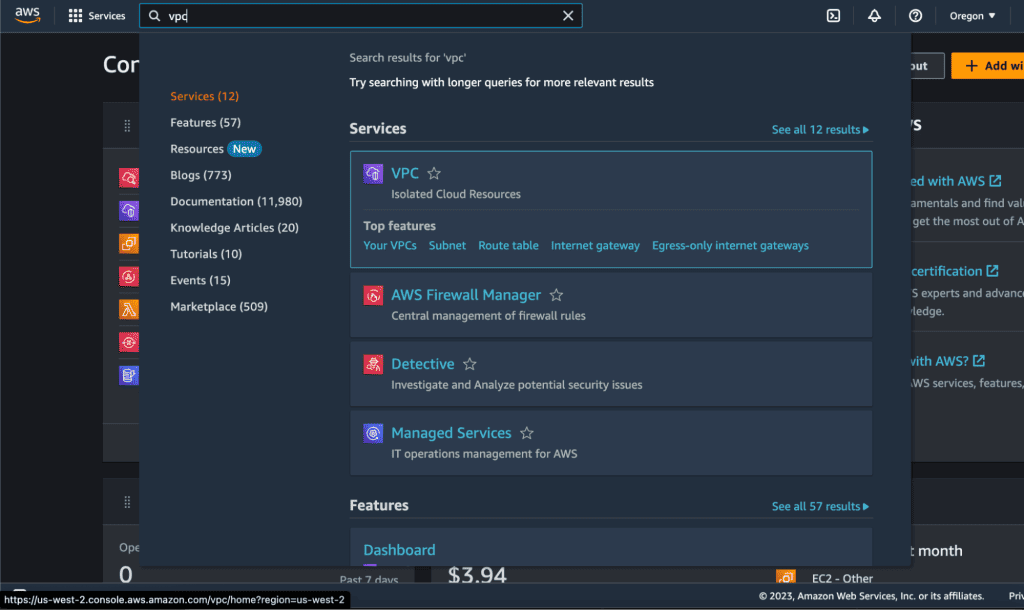
Click on the “VPCs.” There will be a list of VPCs that you have created. If you haven’t created a VPC, see our tutorial on how to create a VPC in AWS.
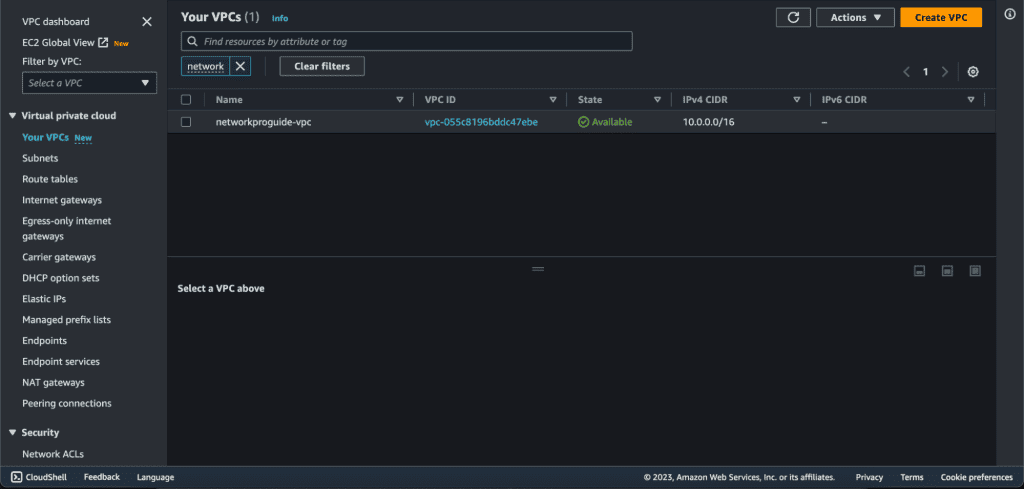
Choose the target VPC for which you want to enable Flow Logs.
In the navigation pane, click on “Flow Logs.”

Click the “Create Flow Log” button.
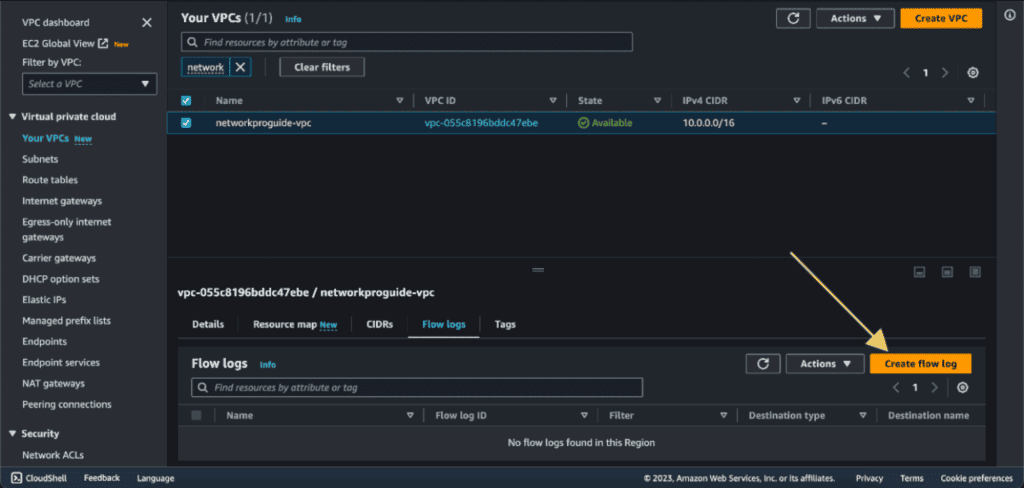
Give the name for the flow log.
In the “Filter” section select “All.” (You can select “Accept” or “Reject” if you want to capture only accepted or rejected traffic.)
Choose a maximum aggregation interval of 10 minutes. (If we select the maximum aggregation interval to 1 minute then it will produce a higher number of flow logs.)

Choose the destination to “Send to CloudWatch Logs.” (We will be sending our flow logs to Cloudwatch.)

Give the name to the destination log group. (A log group is a collection of log streams that have the same monitoring, access control, and retention settings.)
In the IAM role section. Click on “Set up permission.” It will open the IAM section in the new tab.
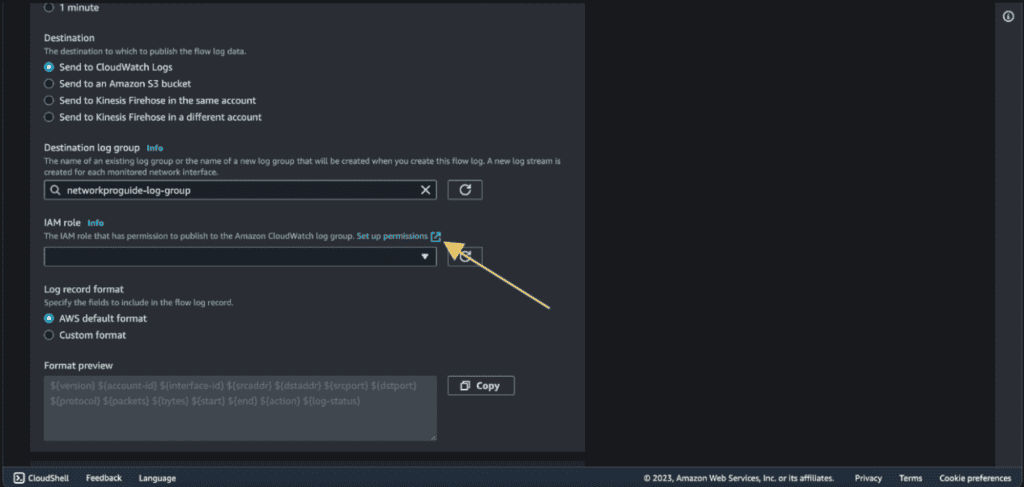
Click on “Create Role.”
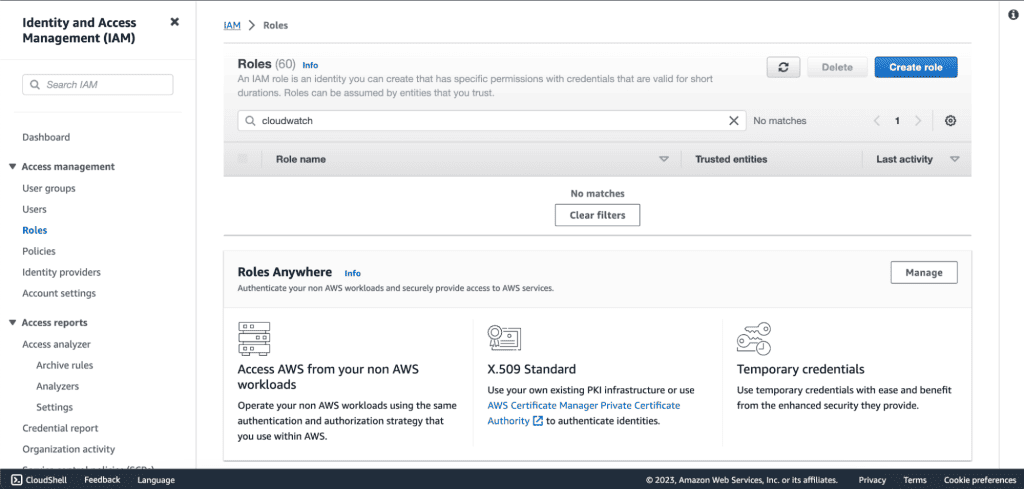
Select “Custom trust policy” on the trusted entity type. And paste the custom trust policy that I have given below.
{
    "Version": "2012-10-17",
    "Statement": [
        {
            "Effect": "Allow",
            "Principal": {
                "Service": [
                    "vpc-flow-logs.amazonaws.com",
                    "ec2.amazonaws.com"
                ]
            },
            "Action": "sts:AssumeRole"
        }
    ]
}
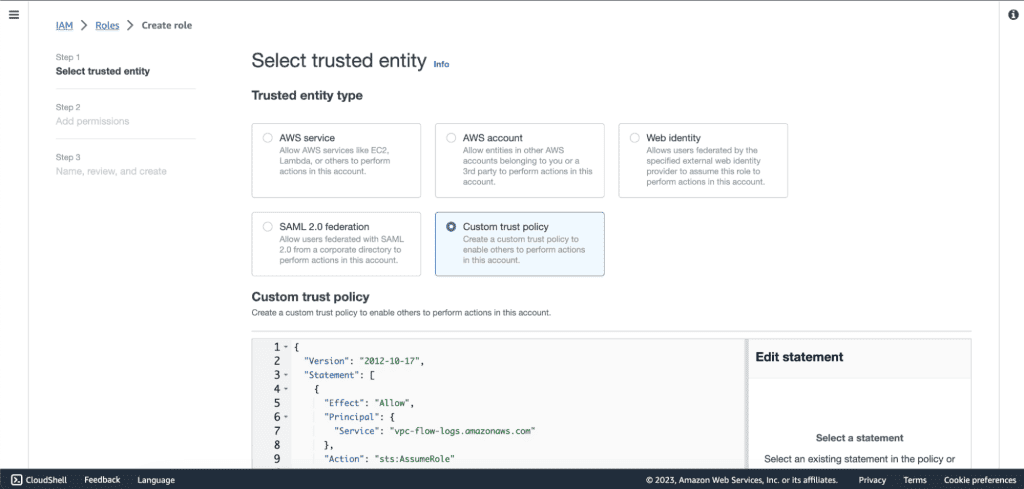
Click on “Next”.
Then click on “Create Policy” in the Add permission section. It will open the new tab.
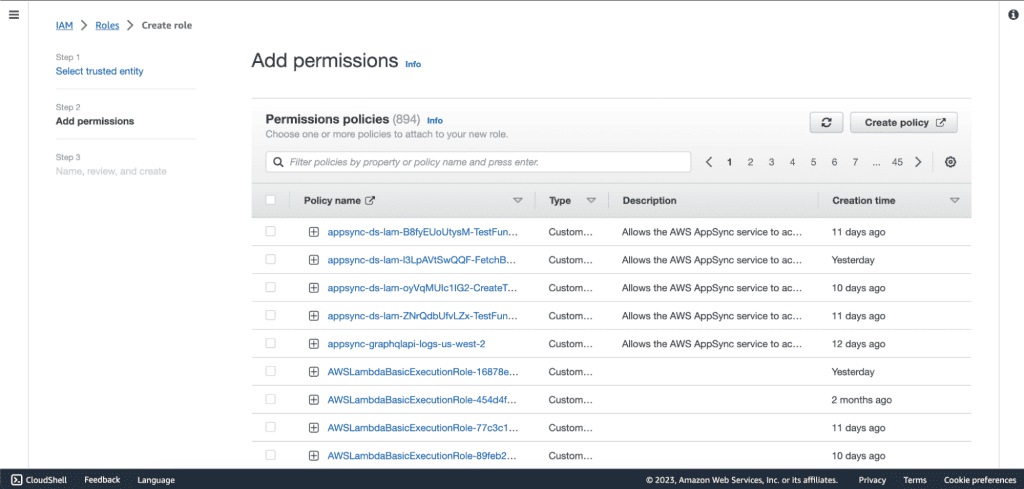
Select “JSON” and paste the following policy.
{
  "Version": "2012-10-17",
  "Statement": [
    {
      "Effect": "Allow",
      "Action": [
        "logs:CreateLogGroup",
        "logs:CreateLogStream",
        "logs:PutLogEvents",
        "logs:DescribeLogGroups",
        "logs:DescribeLogStreams"
      ],
      "Resource": "*"
    }
  ]
}
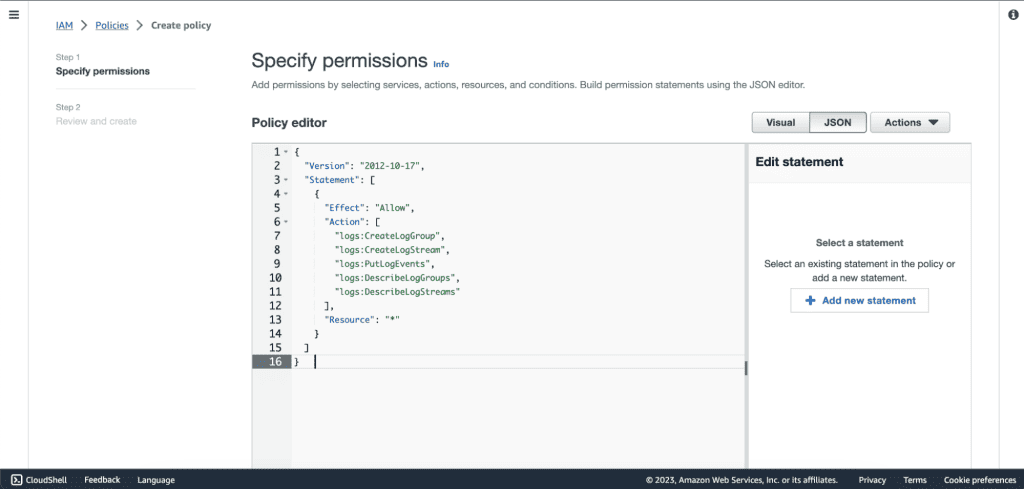
Click on “Next”.
Give the name of the policy and click on “Create policy.”

Now go to the Create Role tab and search for the policy that we have just created. (If you can’t see the policy then click on the refresh icon near the create policy button.)
Also add the “CloudWatchLogsFullAccess” policy.
Select that policy and click on “Next.”
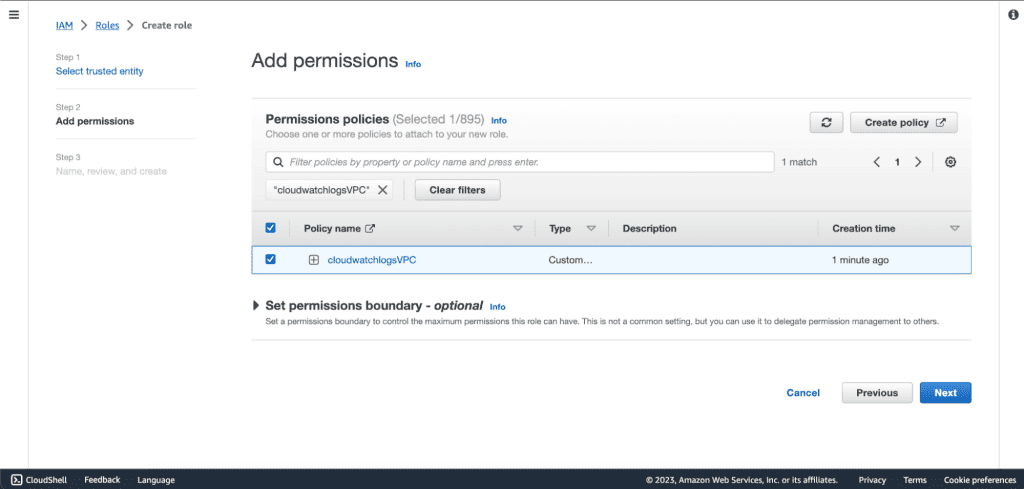
Give the name of this role and a description.
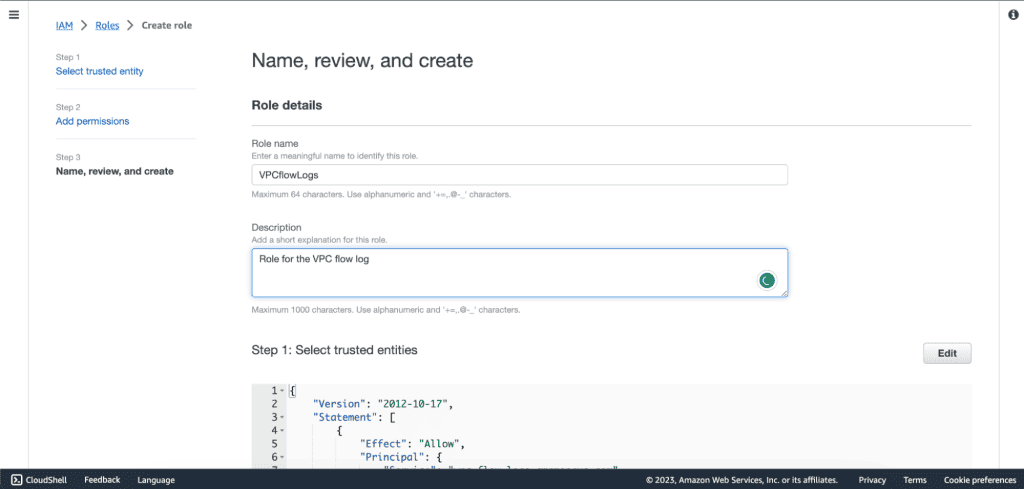
Review the role and click “Create role.” The role for the VPC flow log will be created.
Now go back to the VPC flow log tab.
Refresh the IAM role and select the role that we have just created.

Select “AWS default format” as a log record format. (If you want a different log format than the default format then choose the custom format and choose the fields that you need.)
Click on “Create flow log.”
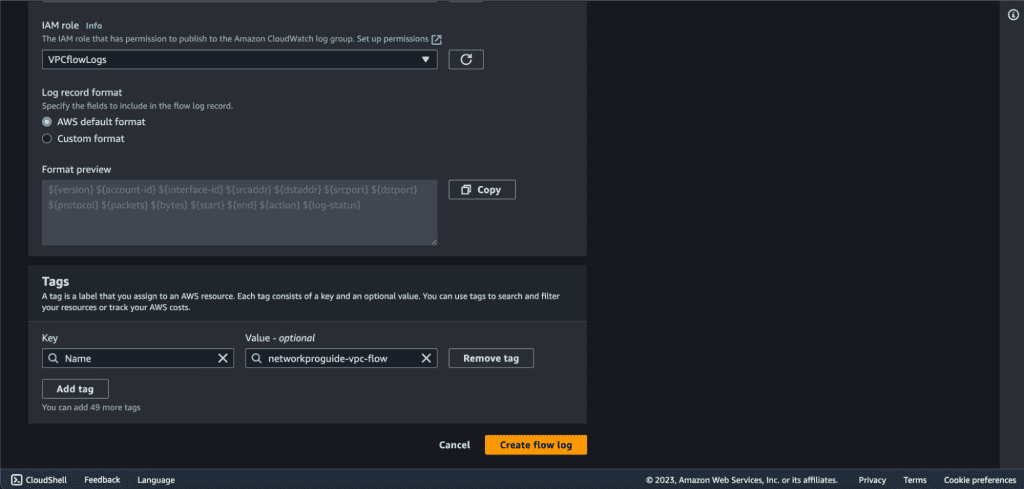
We have successfully created the VPC flow log.
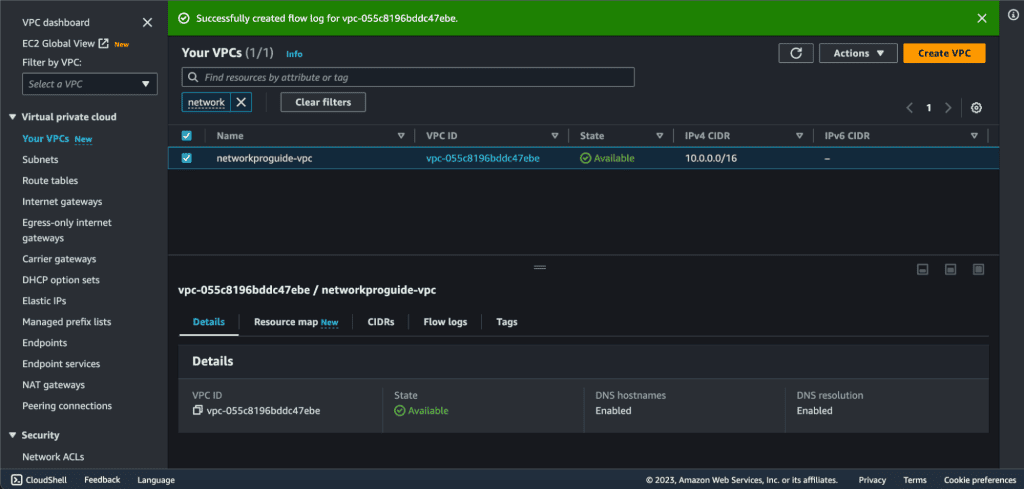
Step 2. Analyzing with CloudWatch
Let’s go to Cloudwatch to see and analyze the VPC flow logs.
Search “Cloudwatch” in the search box and go to the Cloudwatch dashboard.
Click on “Log groups” and select the log group that we have named before for the VPC flow logs.
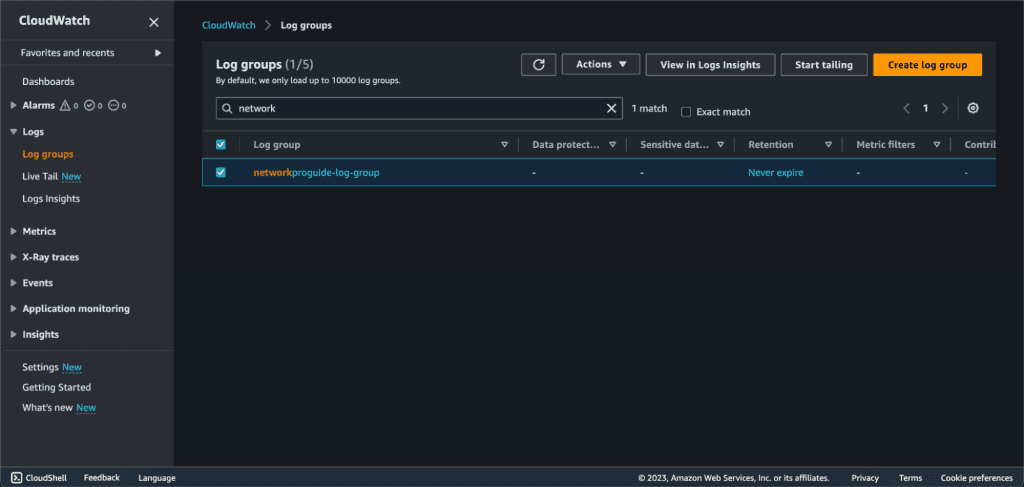
Click on the log group name to see the logs or click on “View in Logs Insights” to see the logs of the VPC.
Now you can explore individual log streams for insights.
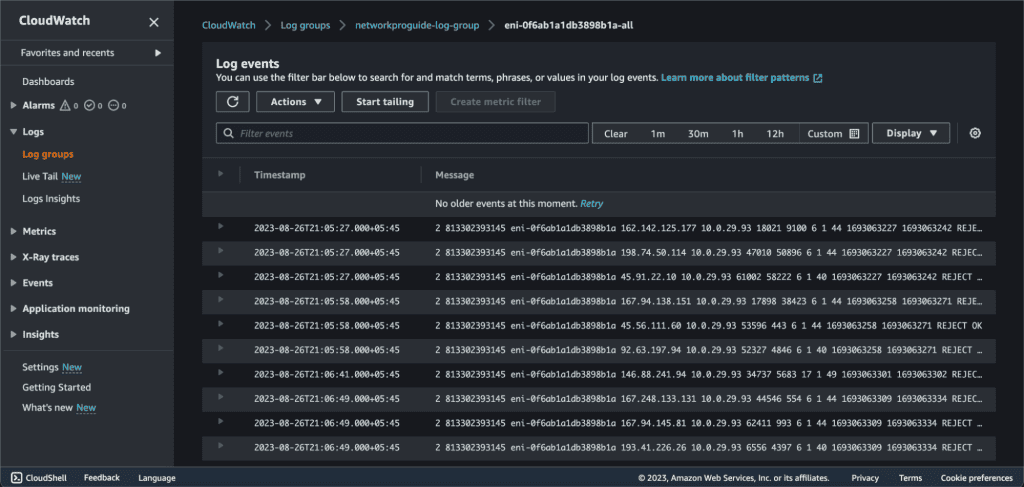
Explore VPC Flow Log Data. You can also use Log Insights and Live Tail for more log visualization and analysis.
Creating Subnet Flow Logs and Analyzing with CloudWatch
Step 1. Creating Subnet Flow Logs
Subnet flow logs focus on the traffic within a specific subnet, allowing you to analyze the traffic behavior at a more granular level.
Go to the subnets section.
Choose the subnet you want to enable Flow Logs for.
Click on “Create flow log” inside the flow logs tab.

Give the name, select “All” in the filter, select “10 minutes” in maximum aggregation interval, and “Send to CloudWatch Logs” in Destination.
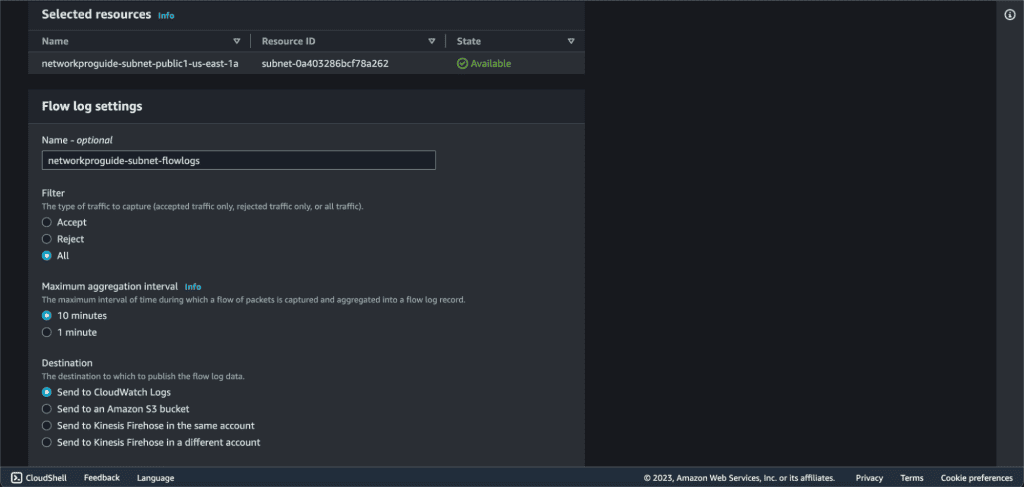
Give the name to the destination log group.
Select the IAM role that we have created above.
Choose “AWS default format” in the log record format.

Click on “Create flow log.” The flow log for your subnet has been created successfully.
Step 2. Analyzing with CloudWatch
Go to the CloudWatch Dashboard.
Click on “Log groups” in the navigation panel and select the name of the log group that we have created above.
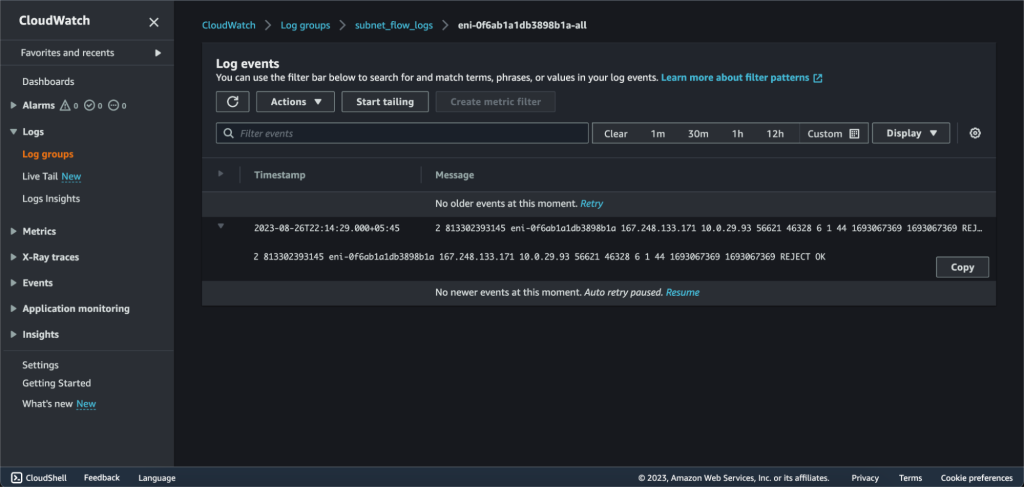
Explore Flow Log Data. You can also use Log Insights and Live Tail for more log visualization and analyzation
Creating Network Interface Flow Logs and Analyzing with CloudWatch
Step 1. Creating Network Interface Flow Logs
Network interface flow logs focus on the traffic of specific network interfaces within your instances, allowing you to monitor individual instance behaviors.
Access the EC2 Dashboard in the AWS Management Console.
Go to the Network and Security section and click on “Network Interfaces.”
Choose the specific network interface you want to enable Flow Logs for.
Click “Create Flow Log.”
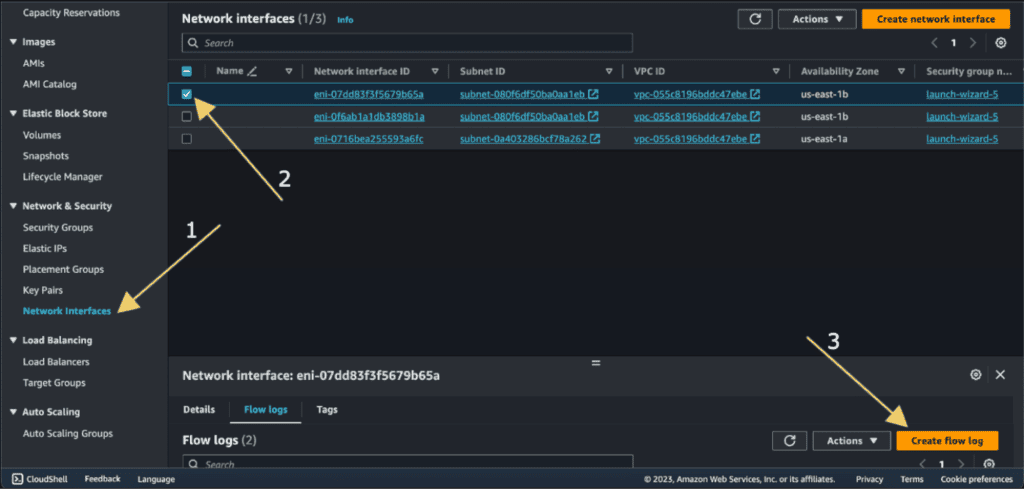
Give the name, select “All” in the filter, select “10 minutes” in the maximum aggregation interval, and “Send to CloudWatch Logs” in Destination.
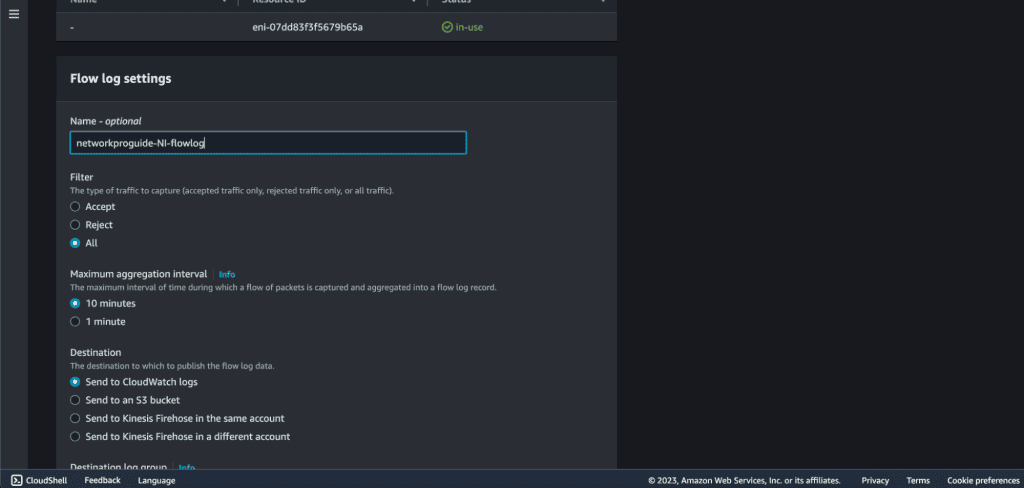
Give the name to the destination log group.
Select the IAM role that we have created above.
Choose “AWS default format” in the log record format.
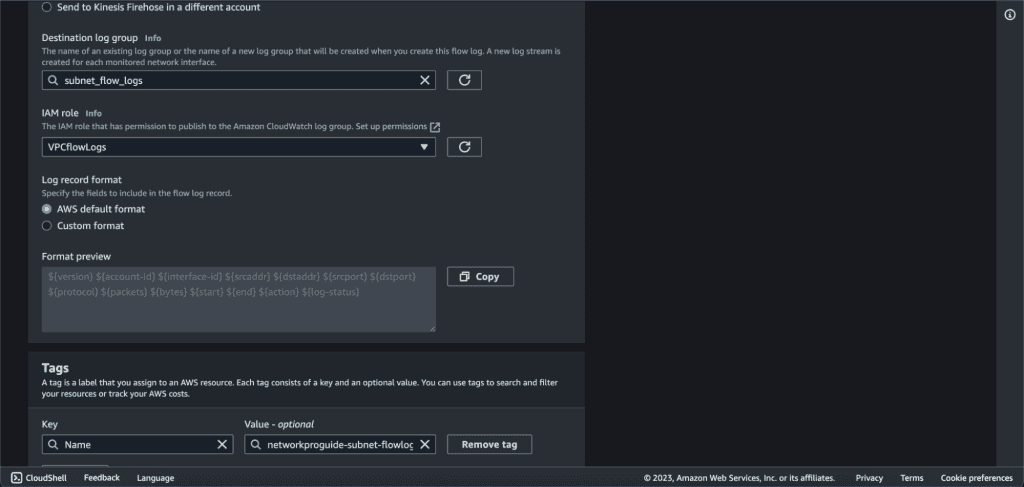
Click on “Create flow log.”
Step 2. Analyzing with CloudWatch
Go to the CloudWatch Dashboard.
Click on “Log groups” in the navigation panel and select the name of the log group that we have created above for the network interface.
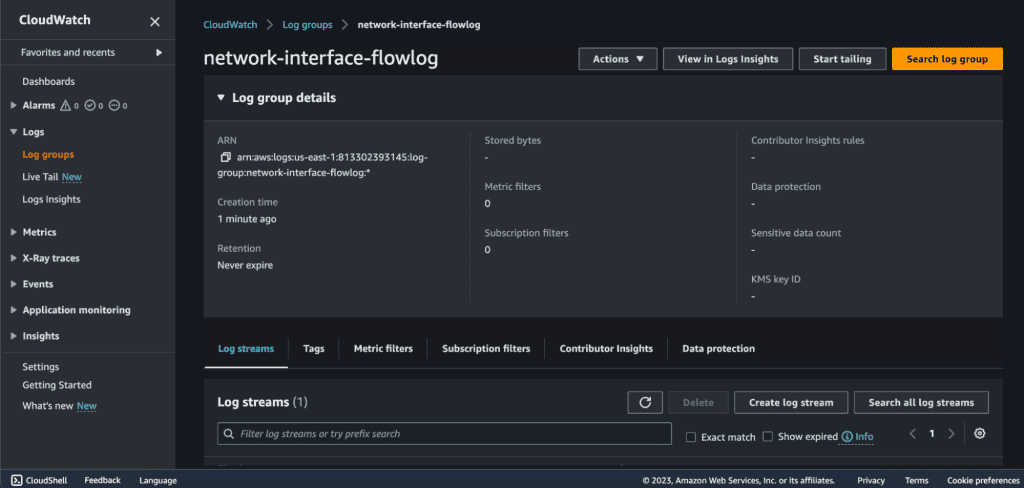
Explore flow log data. You can also use Log Insights and Live Tail for more log visualization and analysis.


